Work Unit 28ja00ab.8459.15794.823572.0
The signals of the following work unit have an interesting structure. For a Doppler drift rate zero, they possess a normal power in the interior of the time-frequency coordinate domain whereas their power is very small on the boundaries of the domain (which run parallel to the time axis). This structure can be observed for all resolutions of the bandwidth used for the evaluation of the data in the work unit.
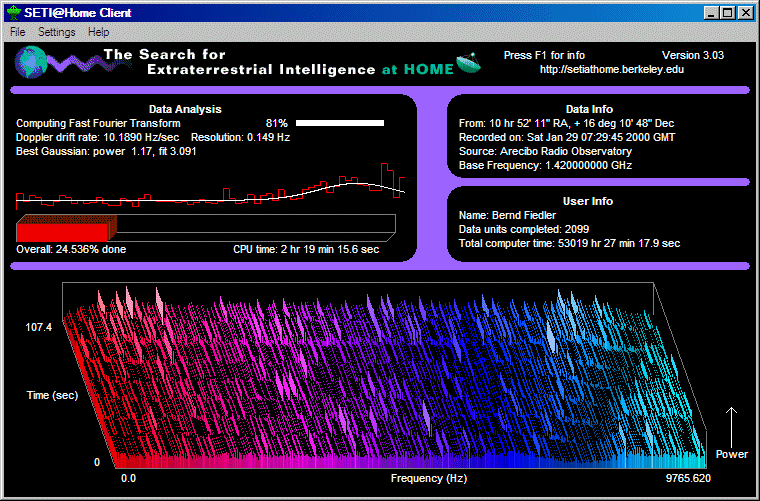
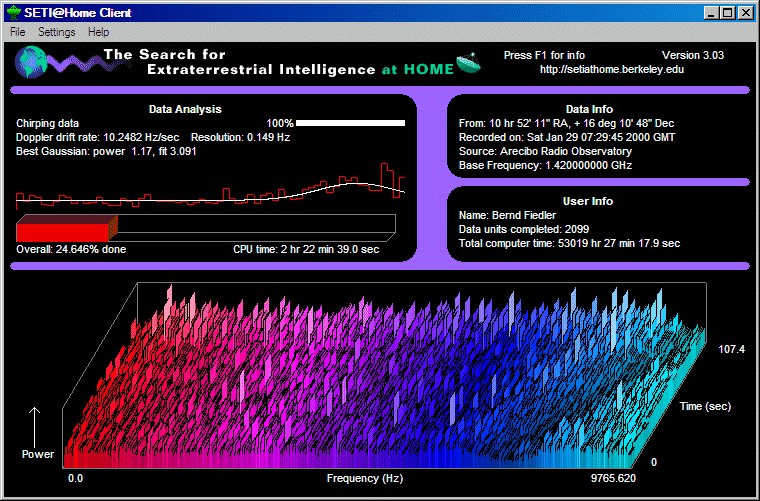
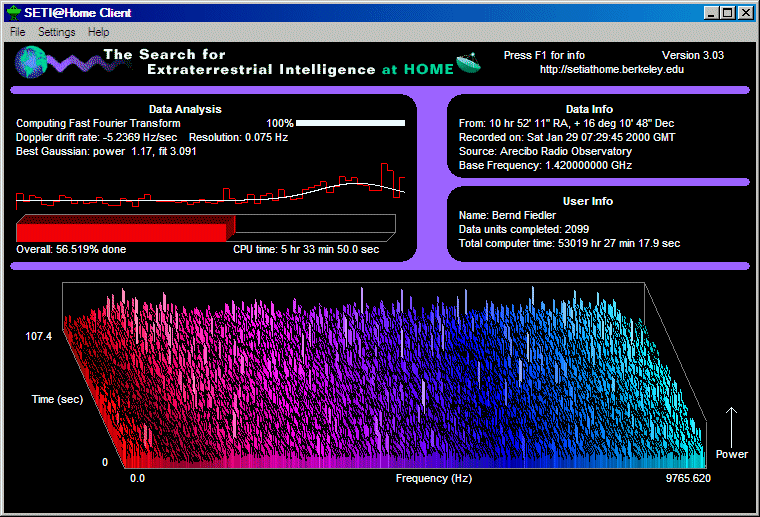
If we carry out an evaluation of the data for large Doppler drift rates, then the bands with small power take the form of grooves which run aslant with respect to the coordinate axes of the plane. Below we present examples both for positive and for negative Doppler drift rates.
We assume that the origin of the signals is a source on Earth because the base frequency of the signals has the round value 1420000000.00 Hz.
| Signal |
number |
strongest signal |
| Gaussians |
1 |
max. score: 0.381 |
drift rate: 8.518 Hz/s |
| pulses |
1 |
max. score: 1.031 |
drift rate: 0 Hz/s |
| triplets |
0 |
|
|
| spikes |
69 |
max. power: 26.626 |
drift rate: -3.3717 Hz/s |
| Overflow |
no |
|
|

|
|
CPU time: 0h 0m 5.4s, Doppler drift rate: 0.0 Hz/s Resolution: 0.149 Hz
|

|
|
CPU time: 0h 1m 25.1s, Doppler drift rate: 0.0 Hz/s Resolution: 38.147 Hz
|

|
|
CPU time: 2h 19m 15.6s, Doppler drift rate: 10.1890 Hz/s Resolution 0.149 Hz
|

|
|
CPU time: 2h 22m 39.0s, Doppler drift rate: 10.2482 Hz/s Resolution: 0.149 Hz
|

|
|
CPU time: 5h 31m 42.0s, Doppler drift rate: -5.2017 Hz/s Resolution: 0.075 Hz
|

|
|
CPU time: 5h 33m 50.0s, Doppler drift rate: -5.2369 Hz/s Resolution: 0.075 Hz
|


